Executions
Executions are a journal of the results of your experiment run. Each time one of your experiments is run as part of a plan, an execution is generated and available in Reliably. It presents the execution’s results and allows you to download a complete execution journal.
Pause / Resume / Stop
If you’re viewing a running experiment, action buttons Pause (or Resume) Execution and Stop Executions are available in the top right corner of the page. They will, as their name implies, allow you to Pause, Resume, or Stop the execution.
Pause Execution
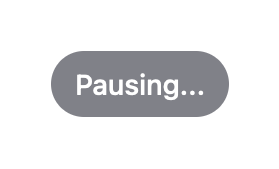
Clicking the Pause Execution button will send a pause signal to Reliably. The execution status will immediately change to Pausing…
At this stage, Reliably is waiting for the current activity to finish, and it will then prevent the execution from continuing.
At the next update of the execution data, if the execution is effectively paused, its status will change to Paused.
Take into consideration that if you are running your execution in the Reliably Cloud you might be subject to an execution duration limit, depending on your pricing plan. The pause will still count toward your execution duration. For example, a free plan has a 10-minutes maximum duration. If you pause an execution after 8 minutes, a 2 minutes pause will cause the execution to be ended.
Resume Execution
If an execution is paused (or pausing), the Resume Execution button is displayed. Clicking the Resume Execution button will send a resume signal to Reliably. This signal will cause the execution to resume almost immediately.
Stop Execution
A running or paused execution can be stopped by clicking the Stop Execution button. When the button is clicked, a modal window will open to confirm your choice and allow you to choose if you want to skip rollbacks.
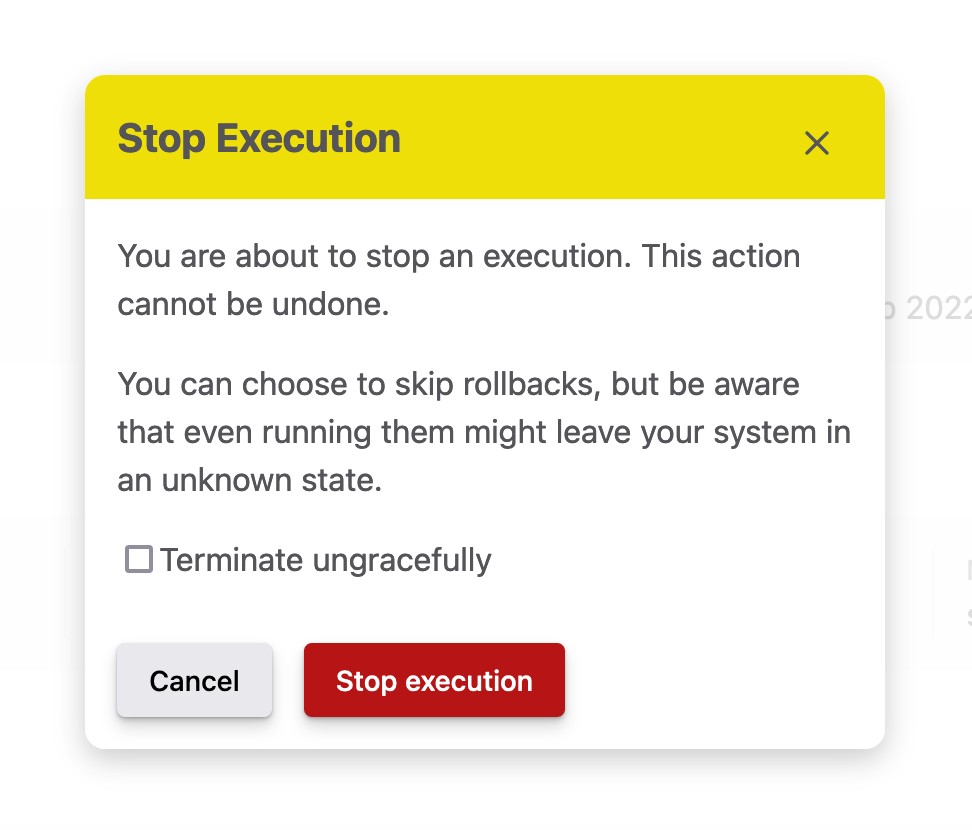
Clicking the Stop Execution button in the modal will send a stop signal to Reliably. The execution status will immediately change to Stopping…

At this stage, Reliably is waiting for the current activity to finish, and it will then stop the execution. If the “Terminate ungracefully” box is left unchecked, the rollbacks will be executed.
At the next update of the execution data, if the execution is effectively stopped, its status will change to Interrupted.
Execution info
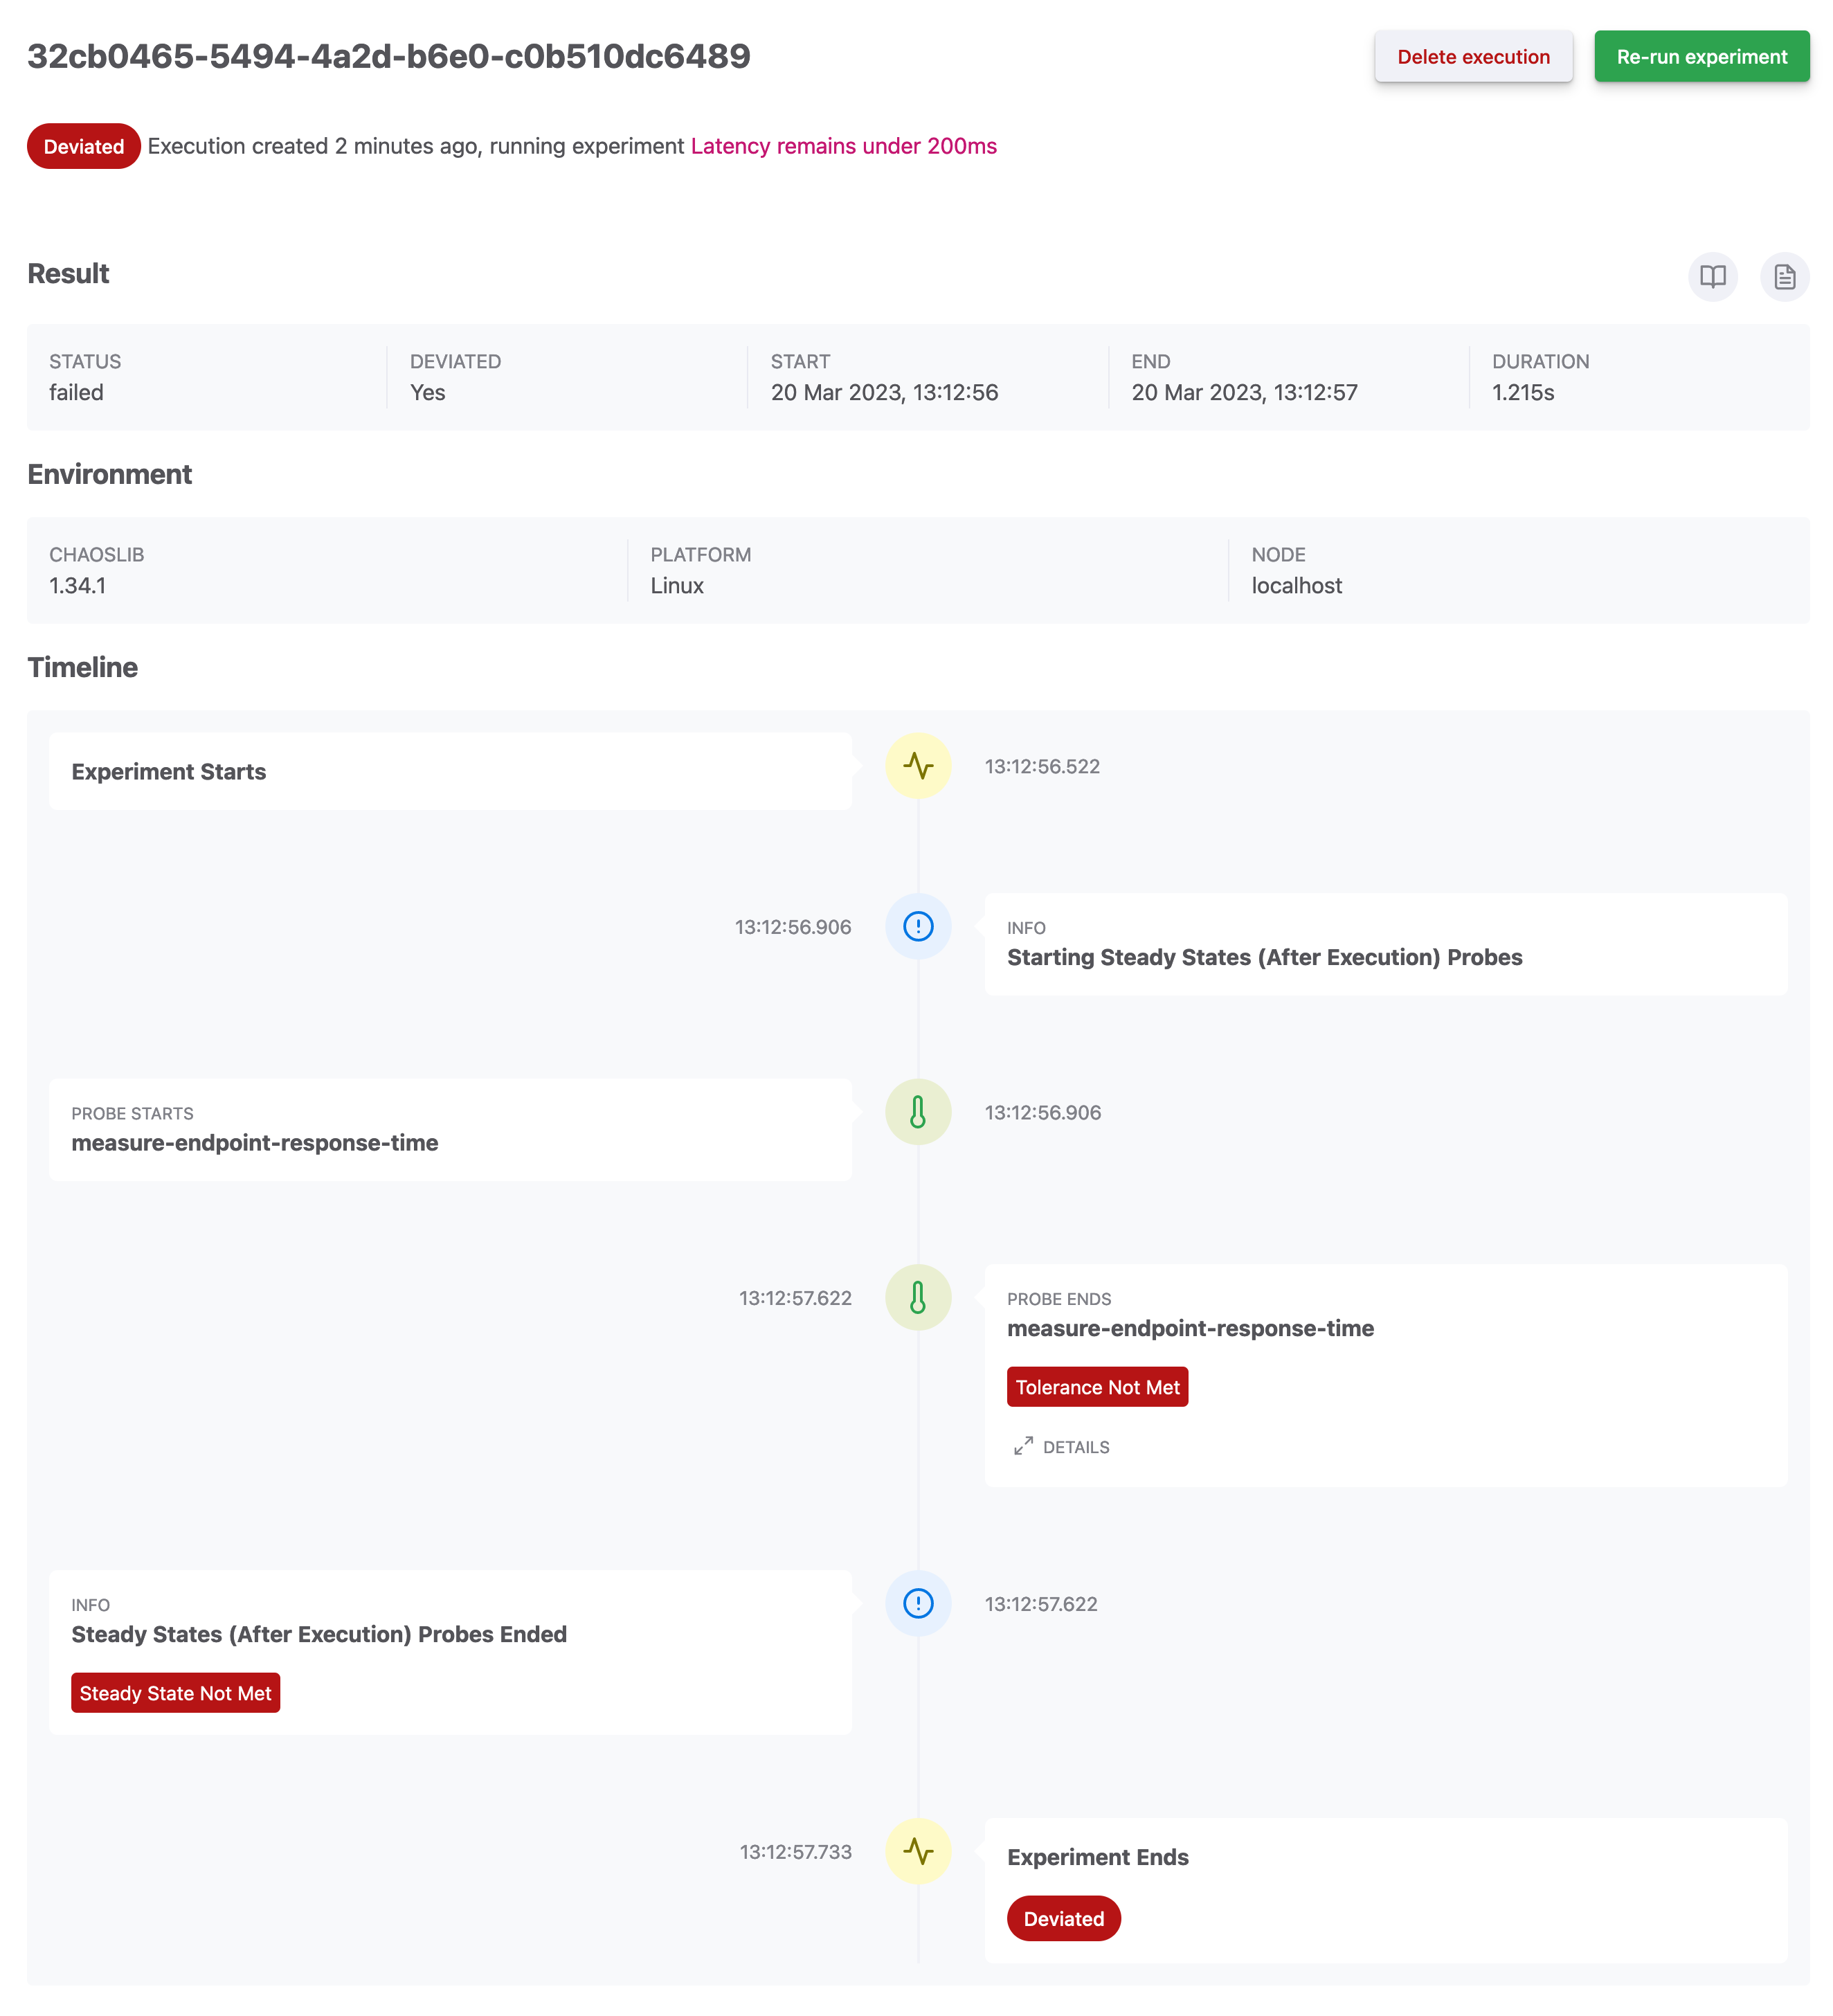
At the top of the page is displayed the execution’s unique UUID, as well as some general information about the execution:
- its status (here, our experiment deviated, meaning its result was not what was expected),
- when it ran,
- the name of the experiment (here, Latency remains under 200ms, which is one of our starters).
Result
This section displays:
- the execution status,
- if the execution deviated,
- when the execution started,
- when the execution ended,
- the execution duration.
It also presents links to:
- the execution journal,
- the execution logs,
- the GitHub workflow page, if it was run as a GitHub Action
Environment
This section presents information about the environment the Reliably experiment was run in.
- ChaosLib is the version of the Chaos Toolkit Library used,
- Platform is the Operating System that was used,
- Node is the name of the machine the experiment was run on.
Timeline
This Reliably timeline is a step-by-step breakdown of all the events that took place during an experiment execution.
It displays the main phases of the execution (steady-state hypothesis, method, rollbacks) as well as each activity that took place.
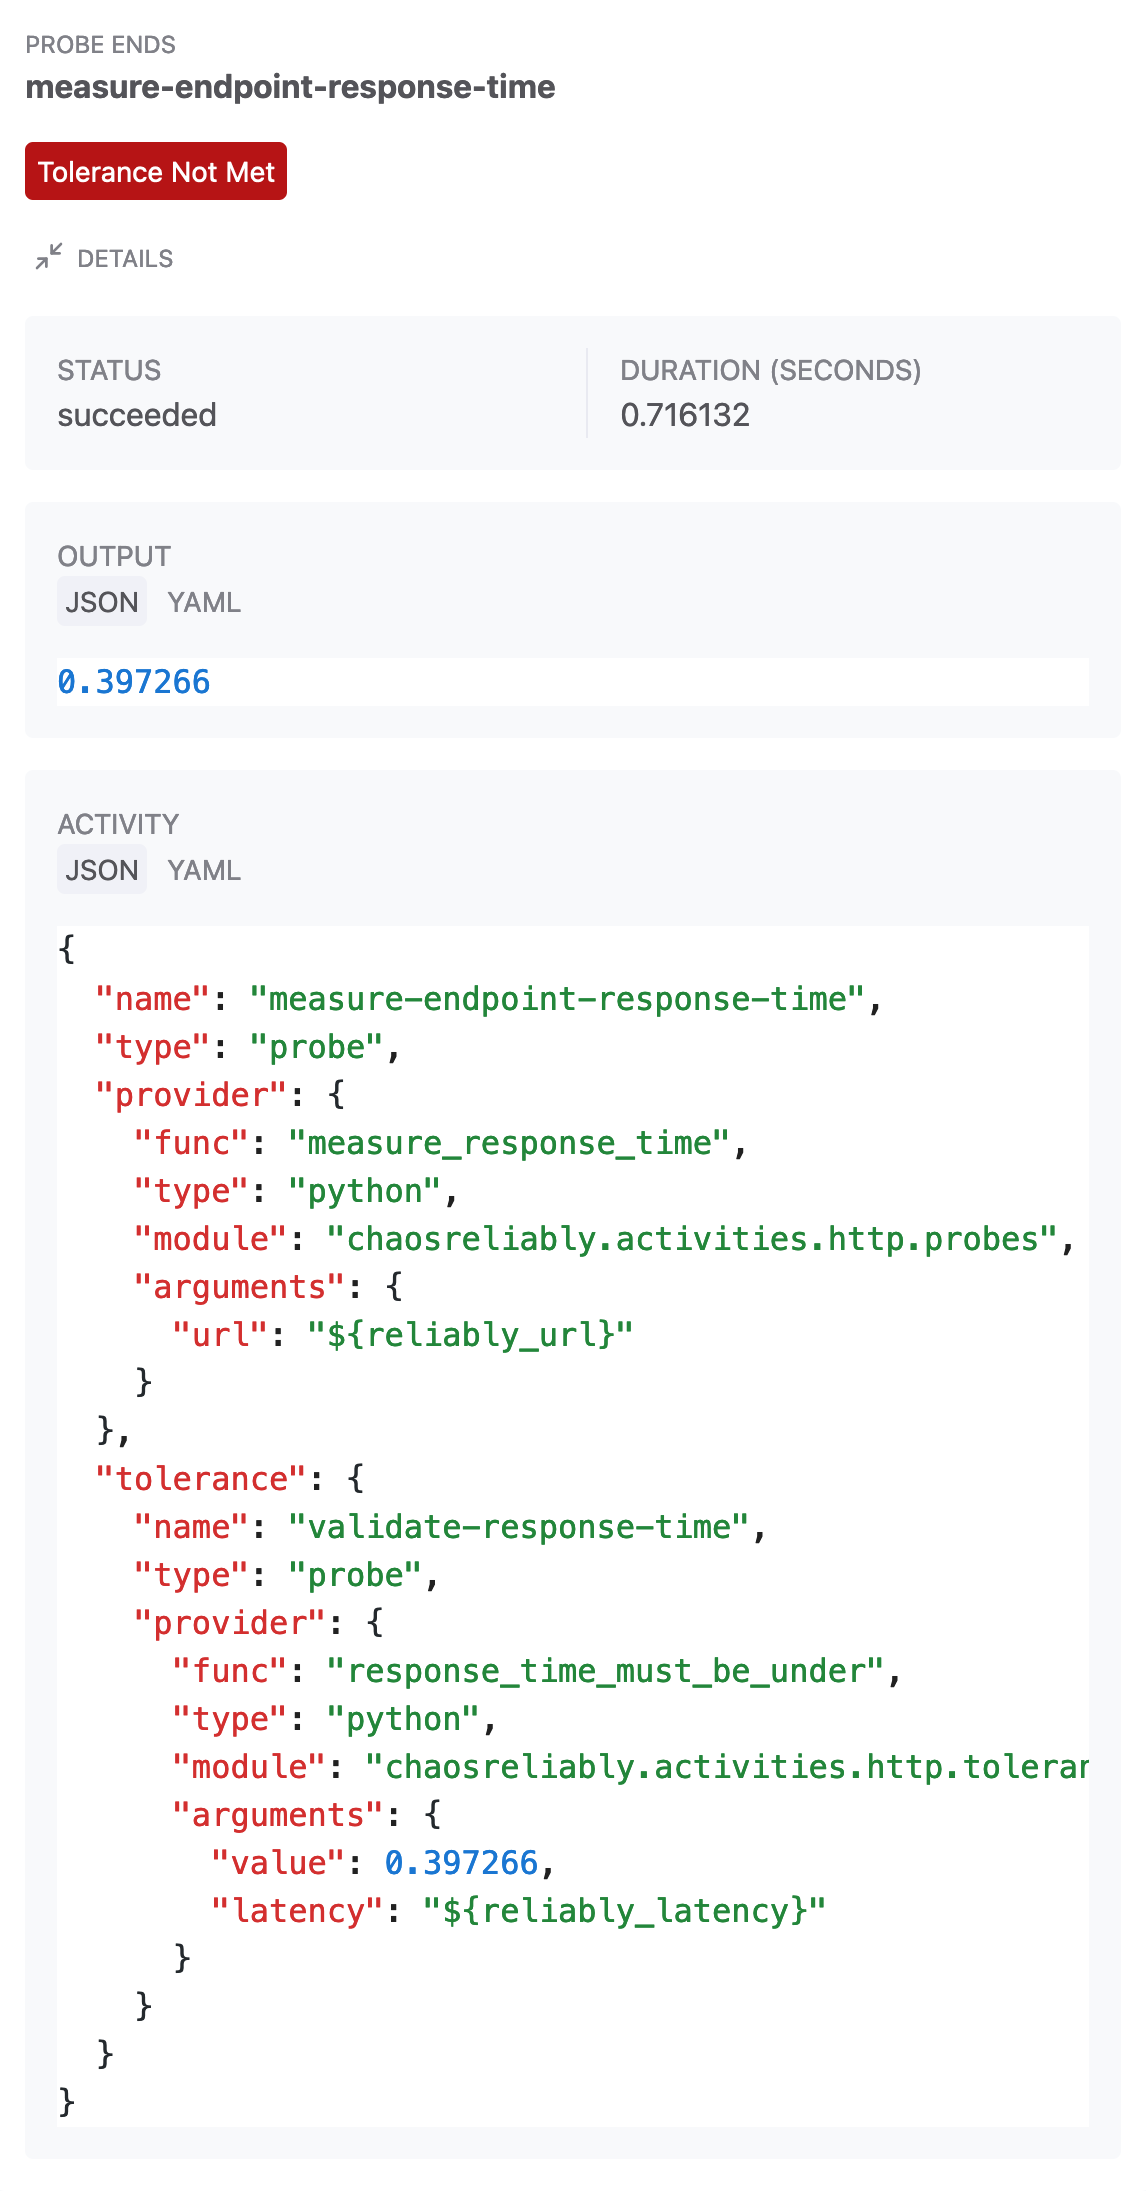
If an activity returns a result, this result is displayed in the event.
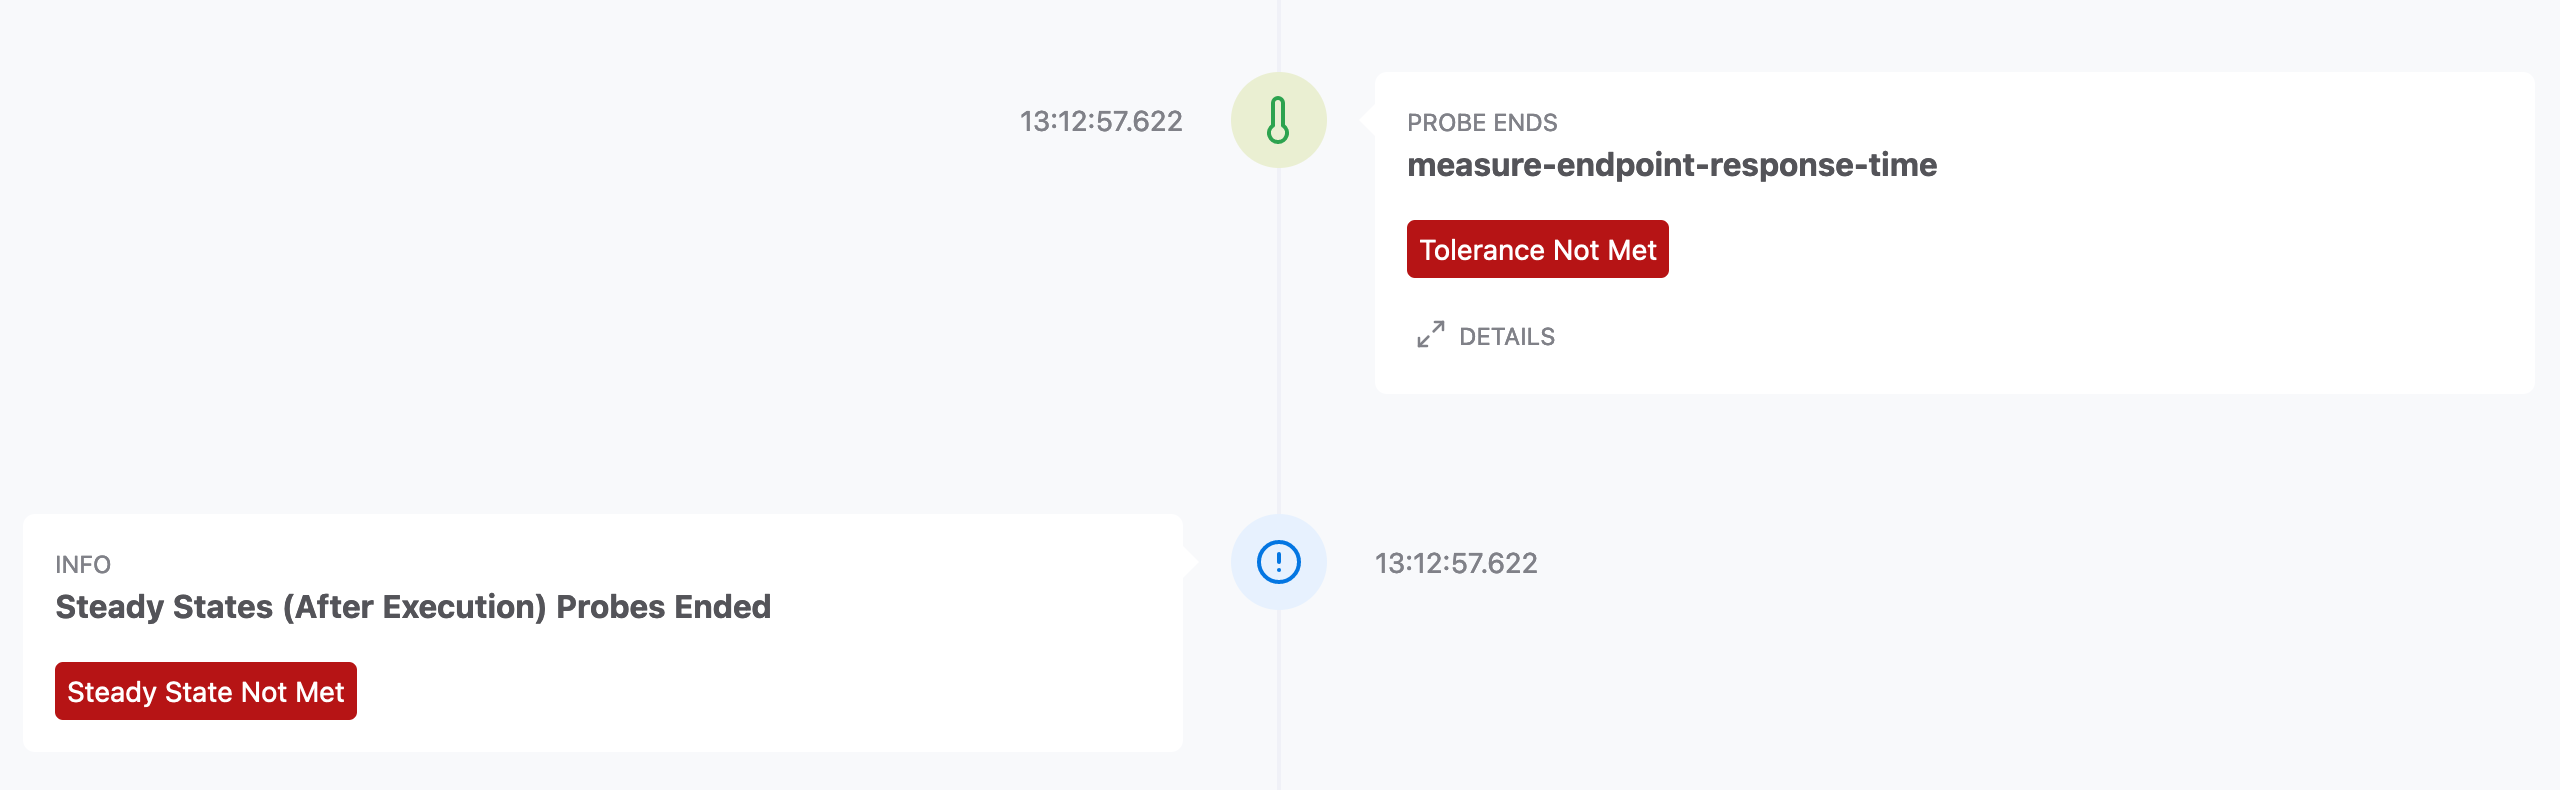
Some activities, such as probes, can return more detailed results. If this is the case, a “Details” button reveals those results.